
This crystal of sanidine, a potassic feldspar, comes from the Uhuru peak, the highest summit on Kibo's crater rim of the mount Kilimanjaro in Tanzania. Kibo is one of the three stratovolcano of the Kilimanjaro and unlike its two companions, Kibo is a dormant volcano.
The crystal is well formed, most of its faces can be easily recognized and identified. The surfaces are not enough smooth, lot of small grains are spread on the faces, the material is dull. The material does not "shine" enough, therefore collecting reflectance spectrum is impossible as is. To remedy that problem, the surfaces can be enhanced by polishing them to give them a much better luster than the one the nature produced.
Even if some surfaces were polished, no attempt to read a RI was carried out, as well as the material is globally opaque to locally translucent, Uv-Vis absporption and photoluminescence spectra are not applicable.
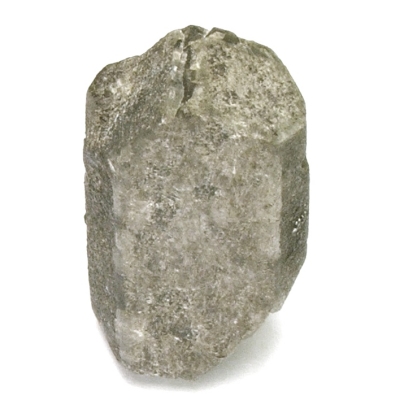 Photo 1: Sanidine crystal from Uhuru peak
| Size | 16.5 x 14 x 28 mm |
| Color | gray |
| Lustre | grasy to vitreous |
| Weight | - |
| SG | - |
Table 1 : Observational and measured properties
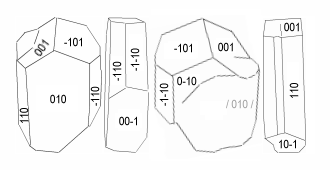 Figure 1 : Miller indices of the faces of the crystal. From left to right, the front as on photo 1, right side, back and left side.
- b : (010), (0-10)
- c : (001), (00-1)
- y : (-101), (10-1)
- M : (1-10), (-110)
- m : (110), (-1-10)
The main crystal is likely having a Carlsbad penetration twin visible on top left c (001) face and back b (0-10) face. The twin b face is marked as / 010 /.
Infrared Reflectance spectroscopy:
The infrared reflectance spectra were acquired from the b, c, y, m and M faces. Most of these faces were slighly and carrefully polished to collect the reflectance without destroying the all crystal, rough surface are not reflective enough. Even that, the acquired signals were not so strong and the spectra were noisy. As observed in Figure 2, all faces produces the same overall spectra without any significant differences. The fingerprint is typical of K-feldspars.
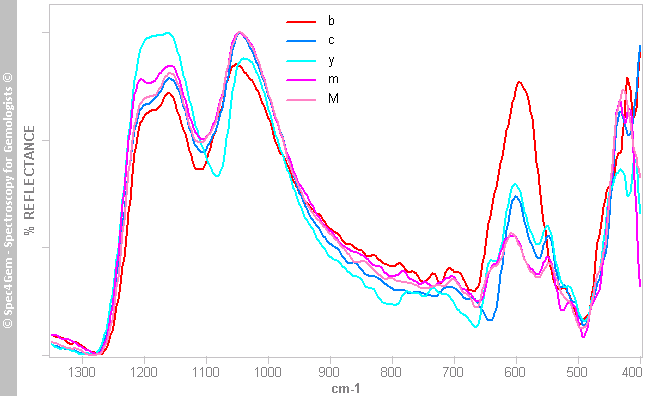 Figure 2: Infrared reflectance spectra of the different faces.
The main differences are observed in the 500 - 650 cm-1 range of the spectra. The b face spectrum presents a single band centered around 592 cm-1 whereas the other c, y, m and M faces spectra have four bands located around 515, 547, 600 and 640 cm-1. These four spectra are very similar as far as the 547 and 600 cm-1 bands are concerned. The 640 cm-1 band is missing in the spectrum of the c face but it has two bands compared to others at about 505 and 520 cm-1.
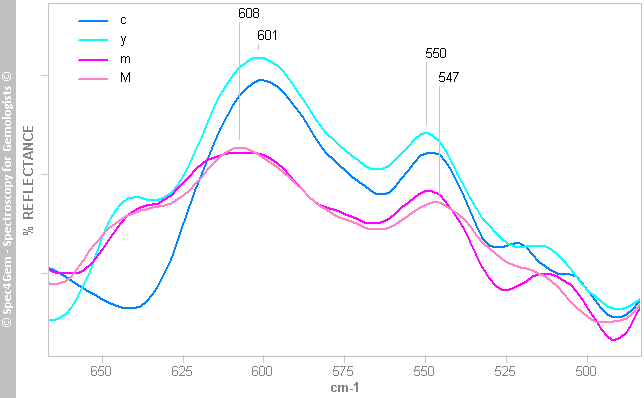 Figure 3 : Infrared reflectance spectra of the different faces in the 500 - 650 cm-1 range.
The spectra of the c, y and m, M faces, zoomed in the 500 - 650 cm-1 region, are presented in figure 3, the b face spectrum was discarded since it differs to much from the others and thus it cannot be compared to the others. The position of the two main bands are summarized in table 2.
| Face | "545 band" (cm-1) | "600 band" (cm-1) | delta (cm-1) | mean (cm-1) |
| c (001) | 548 | 601 | 53 | 574.5 |
| y (-101) | 550 | 602 | 52 | 576 |
| m (110) | 549 | 607 | 58 | 578 |
| M (1-10) | 547 | 608 | 61 | 577.5 |
All the "545 bands" are located in a range of 4 cm-1 unlike the "600 bands" which are spread over 8 cm-1. The distance (noted delta) between the two bands is not constant and vary of about 9 cm-1 whereas the mean (central position between the two bands) vary in a range of only 3.5 cm-1, thus 576.25 cm-1 +/- 1.75.
Discussion:
some text