
This scapolite was found on the internet and sold as a "Peach color scapolite with a color change", it is reportedly coming from Pakistan. The overall color is light yellowish brown but because of the cut, the color is intensified on the sides as it can be observed on photo 1.
The stone is pretty well cut except few visible scratches on the table that can be easily seen on photo 1 and a pavilion that is slighly too deep.
According to Pradat 2012[1], the best gemological property to separate scapolite varieties from each others - marialite, scapolite, meionite - is to use the refraction index of the ordinary ray (no). With its no = 1.561, this stone is assumed to have a meionitic content estimated around 35%, thus this scapolite is a marialite.
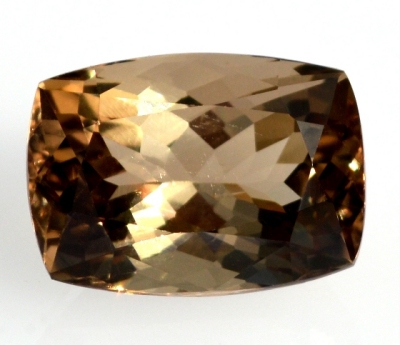 Photo 1: 14.11 ct marialite scapolite reportedly from Pakistan
| Size | 16.9 x 12.2 x 10.6 mm |
| Color | light yellowish brown |
| Lustre | vitreous |
| Weight | 14.11 ct |
| SG | 2.65 |
| RI |
1.547 - 1.561 |
| DR | 0.014 |
| Optical character / sign | U - |
| Pleochroism | light yellowish brown to very light yellowish brown |
| Polariscope / Conoscope | dark/light every 90° / uniaxial |
| SWUV | red |
| LWUV | inert |
| Other | light color change from light yellowish brown to light pinkish brown |
Table 1 : Observational and measured properties
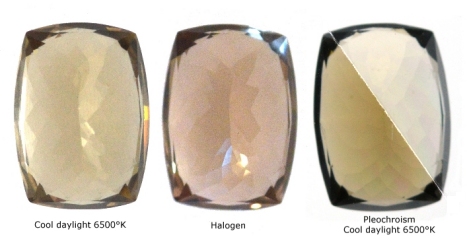 Photo 2: Colors in transmitted lights (cool daylight and halogen), pleochroism with crossed polarizers dichroscope in transmitted cool daylight.
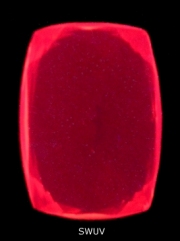 Photo 3: Red luminescence under SWUV
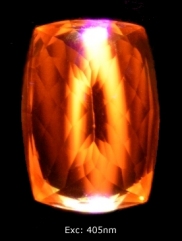 Photo 4: Orange luminescence with a 405 nm laser
Earlier studies have been published on the subject by Sundius (1915), Winchell (1924, 1951) and more recently by D.M. Shaw (1960) in his article 'The geochemistry of scapolite'. The latter uses the mean of refraction indexes (nm) through a linear regression as follows :
%Me = (nm - 1.5346) / 0.000507
Applying this to the present stone, nm being 1.554, it gives a meionitic content around 38%.
Infrared reflectance spectroscopy:
The infrared reflectance spectrum was acquired from the table which is large enough to get a good signal without any particular preparation of the sample. The overall shape of the reflectance spectrum from the Figure 1 with its main reflectance bands located in the range from 800 cm-1 to 1100 cm-1, clearly indicates that the sample is a silicate.
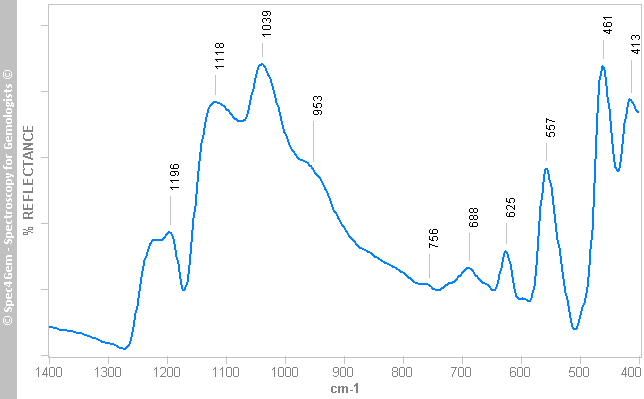
Figure 1: Infrared reflectance spectrum of the 14.11 ct scapolite - The overall shape clearly indicates the sample is a sillicate (main reflection bands in the range 800 cm-1 to 1100 cm-1).
There is an interesting feature in scapolites spectra that consists in using the position of the 610/620 cm-1 band to determine the meionitic content. Wehrenberg (1971) has established the position of the absorption band for scapolites ranging in composition between Me20 and Me75. The results of his study cannot be applied as is to the reflectance band since its position depends on the bands that are close to it and reflectance bands are generally shifted in comparison to their absorption band counterpart. Here, the concerned band located around 620 cm-1 is followed by a weaker band at 688 cm-1 that makes the band of interest slightly shifted compared to the corresponding absorption band while the preceding band which is a quite strong band at 557 cm-1 does not influence it.
The 625 cm-1 band (in fact : 625.5 cm-1) indicates barely that this scapolite is a marialite with a meionitic content around 35% with an error of +/-5%, so a meionitic content that ranges from 30% to 40%.
Photoluminescence spectroscopy:
To acquire the photoluminescense spectra a setup was arranged to measure the emitted light in a direction perpendicular to the excitation ray of the LED laser to avoid to be dazzled by its powerful light. A longpass filter with a cutoff at 450 nm is also used.
Two configurations were used, the first one points the laser ray to the culet in a direction which is parallel to the C axis and the last one points the laser to the culet in a direction which is perpendicular to the C axis.
As for other spectra that depends on light polarization, the emission spectrum can also be depending of the direction of light in the crystal. Using a polarizer for the exciting light is possible but the benefits are not so worth of the investment. Simply orienting the light in the crystal gives significant results.
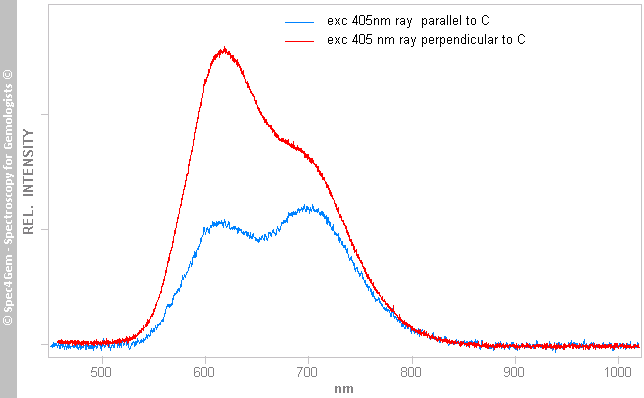
Figure 3: Phtoluminescence spectra with a 405 nm excitation ray parallel and perpendicular to the C axis.
Figure 3 shows the spectra obtained with the two setups. Spectra are very similar with an emission around 600 nm and another one around 700 nm. The main difference consists in the difference of levels between the two emission peaks. With the excitation perpendicular to C axis, the emission peak around 600 nm is higher than the 700 nm peak, whereas with the excitation parallel to C axis, the emission peak around 600 nm is lower than the 700 nm peak.
A peak fitting process on the spectra gives a specific position of the emission peaks. The results of this process are visible in the figures 3a and 3b. The position of the emission peaks are summarized in the table 2 with their attribution.
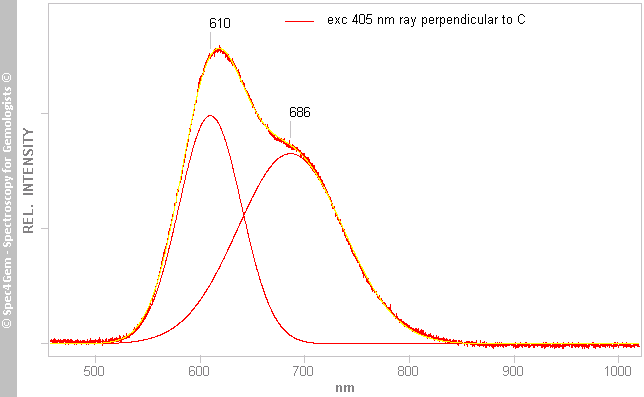
Figure 3a : Peak fitting of the photoluminescence produced by the excitation perpendicular to C axis.
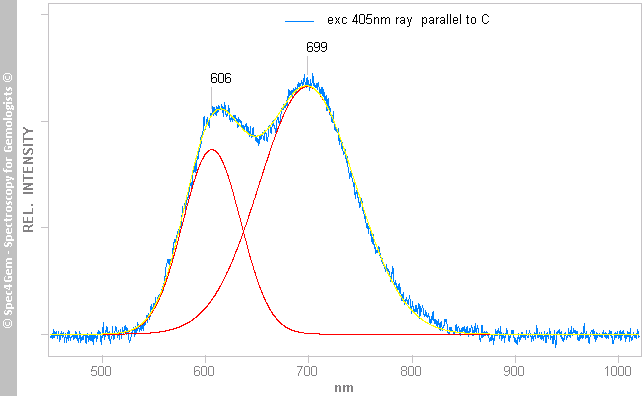
Figure 3b : Peak fitting of the photoluminescence produced by the excitation parallel to C axis.
The photoluminescence was also observed with a SWUV excitation at 254 nm, the spectrum is depicted in figure 4. The spectrum consists in only one emission peak located around 706 nm.
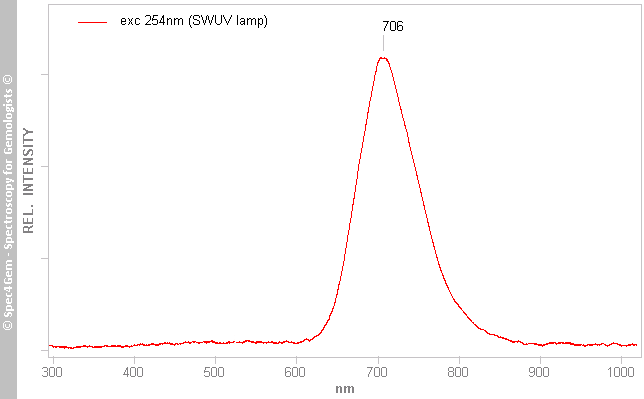
Figure 4 : Photoluminescence spectrum produced by a 254 nm excitation (SWUV lamp).
Discussion:
The stone is a marialite scapolite.