
Ethiopia is famous for its opal but far less for its emerald that is now part of its growing list of commercially significant gems. From time to time, emeralds have been mined, near Dubuluk, for more than a decade, the deposit being located about 80 km from the Kenyan border. In 2016, a new deposit of high-quality emeralds has been found in the rural villages of Kenticha and Dermi, in the Seba Boru district. The emeralds from both locations are traded in the town of Shakiso located approximately 160 km north of the Dubuluk' emerald deposit and 40 km north of the new Kenticha' deposit.
The crystal presented in figure 1 was got from a dealer selling 'wello' opals and a parcel of schist-hosted emerald. It was impossible to get the information about the locality of these emeralds except they were mined by his family. Kenticha, Dubuluk or another locality, it does not really matter, this crystal definitely remains an interesting Ethiopian emerald specimen.
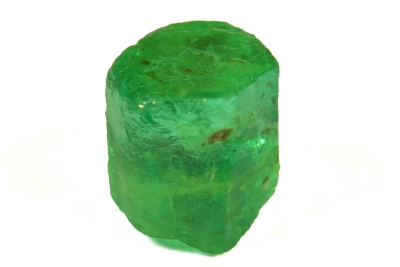 Figure 1. The 3.60 ct crystal coming out of Ethiopia shows a well
shaped hexagonal prism form and a great color, simply green without
too much blue.
| Shape | crystal with hexagonal prism form and a basal pinacoid and a broken end |
| Size | 7.0 x 6.7 x 6.6 x 7.6 |
| Color | green |
| Lustre | dull vitreous |
| Weight | 3.60 ct |
| SG | 2.73 [Dubuluk deposit: 2.72 [1], Kenticha and Dermi: 2.73 [2]] |
| RI | ~ 1.580-1.588 [Dubuluk deposit: 1.578-1.585 [1], Kenticha and Dermi deposit: 1.581-1.589 [2]] |
| DR | 0.008 |
| Pleochroism | weak: slightly-yellowish-green | slightly-bluish-green |
| Polariscope / Conoscope | Uniaxial figure observed down the C-axis |
| SWUV | inert |
| LWUV | inert |
| Magnetic susceptibility | N52: very weak (-0.05) |
Table 1. Observational and measured properties
Infrared reflectance spectroscopy:
The IR reflectance spectra (figure 3) were acquired from two faces of the crystal, the (0001) spectrum in green from the top of the crystal and the (1010) spectrum in blue from one of the prism face. The spectra are characteristic of the emerald variety of beryl. The bands positions may vary from one emerald to another, here the bands are in the low end of the varying range. For example, the last main band towards high energies is as low as 1267 cm-1.
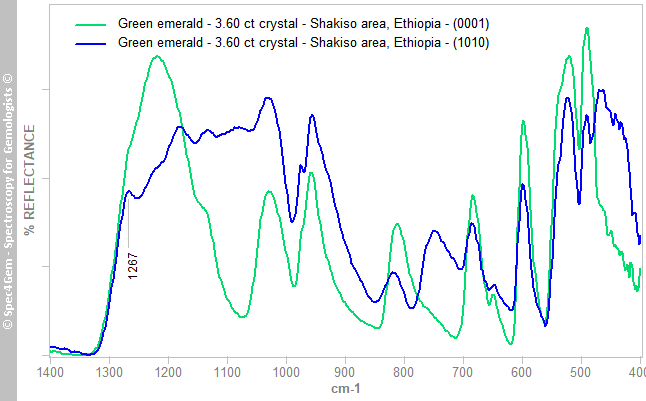 Figure 3. The IR reflectance spectra of this 3.60 ct emerald crystal were acquired from two faces of the crystal, the (0001) spectrum in green from the top of the crystal and the (1010) spectrum in blue from one of the prism face, show characteristic spectra of beryl emerald variety. The last main band towards high energies is as low as 1267 cm-1.
UV-VIS-NIR spectroscopy:
Two UV-Vis-NIR spectra (figure 4) were acquired from the crystal, the lime-green for the ordinary ray (E_||_C), the dark-green for the extraordinary ray (E_|_C). Both spectra show the characteristic Cr3+ and Fe2+ spectra' patterns observed for emeralds. Absorbance between both spectra cannot be compared as is because the light path length is different in each spectrum. The 436, 607, 638 and 684 nm bands are related to Cr3+, the 370 nm one to Fe3+, the 829 nm one to Fe2+ and the 960 nm one to H2O.
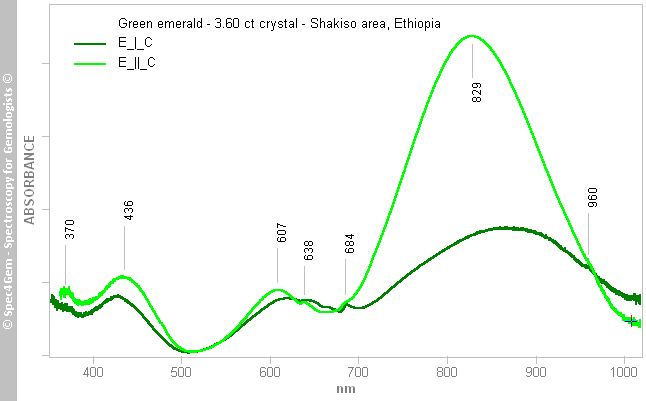 Figure 3.The oriented UV-Vis-NIR spectra acquired from the crystal show the characteristic Cr3+ and Fe spectra patterns observed for emeralds. Absorbance between both spectra cannot be compared as is because the light path length is different in each spectrum. The 436, 607, 638 and 684 nm bands are related to Cr3+, the 370 nm one to Fe3+, the 829 nm one to Fe2+ and the 960 nm one to H2O.
Photoluminescence spectroscopy:
The photoluminescence spectra (figure 5) were acquired with a 405 nm laser excitation source. The red spectrum (beam_||_C) corresponds to the emission induced by the laser's beam oriented parallely to the C-axis although the lilac one (beam_|_C) corresponds to the emission induced by the laser's beam oriented perpendicularly to the C-axis. The red spectrum (beam_||_C) was shifted for clarity.
Both spectra are similar with a wide emission peaking at 715-718 nm associated to a narrow emission peak at 687-688 nm. The later emission depends on the polarization, it is stronger and better defined while the laser's beam is parallel to C-axis. These emissions are ascribed to Cr3+ in beryl, the 687-688 nm one being related to the Cr3+ R-lines.
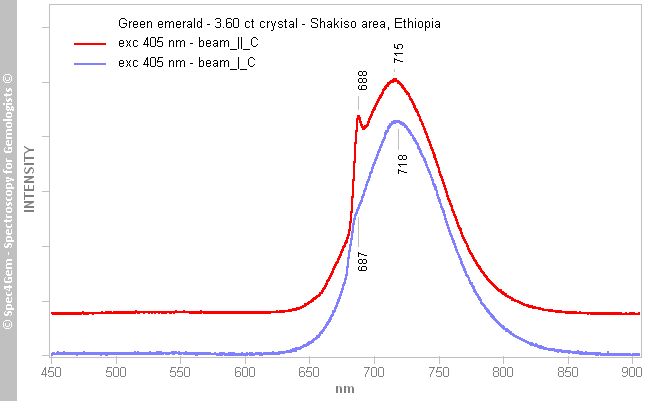 Figure 5. Photoluminescence spectra acquired from the crystal using two distinct 405 nm laser beam orientation, the red one with the laser's beam parallel to C-Axis and the lilac one with the laser 's beam perpendicular to C-axis. Both spectra are similar with a prominent emission at 715-718 nm and a narrow emission peak at 687-688 nm which depends on the excitation's polarization. Emission features are the result of Cr3+ impurities in the crystal structure.
Conclusion:
Classical gemology results are consistent with those found in the few published literature related to Ethiopian emeralds. UV-Vis spectroscopy shows this crystal is an emerald sample colored by Cr3+, and even if Fe2+/Fe3+ are also present they do not influence the color, their respective features being outside the visible spectrum. PL spectroscopy confirms the presence of Cr3+.
[1] Emerald from Ethiopia, P. Cevallos, W. B.(Skip) S. and A. U. Falster, Gems & Gemmology, 2012, Fall, pp. 219-220
[2] A new discovery of emeralds from Ethiopia, N. Renfro, Z. Sun, M. Nemeth, W. Vertriest, V. Raynaud and V. Weeramonkhonlert, Gems & Gemmology, 2017, Spring, pp. 114-116
[3] New Production of Emerald from Ethiopia, B. M. Laurs, E. Strack, Journal of Gemmology, 2017, volume 35, No.5, pp. 386–387