
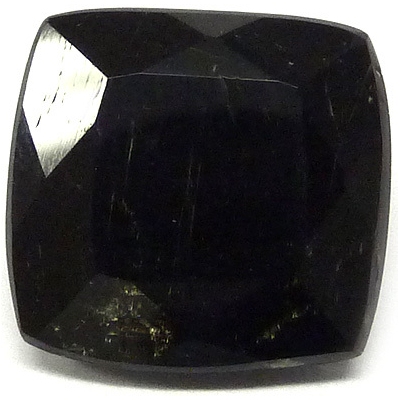
 Photo 1: An unusual facetted 8.60 ct black amphibole.
| Shape | cushion |
| Size | 13.2 x 12.6 x 7.2 |
| Color | black |
| Lustre | vitreous |
| Weight | 8.60 ct |
| SG | 3.08 |
| RI | 1.631 - 1.655 |
| DR | 0.024 B+ |
| Pleochroism | - |
| Polariscope / Conoscope | - |
| SWUV | - |
| LWUV | - |
| Magnetic susceptibility | weak to moderate (29%) |
Table 1 : Observational and measured properties
Two additional samples were examined, both have similar optical properties, RI is 1.630 - 1.653, DR 0.023 and the SG is constant with 3.08.
The properties of the main sample were compared to the properties of some amphiboles as listed in the table 2. The first immediate result is this sample does not match with hasingsite and magnesio-hastingsite as it was assumed by sellers. After the table, the sample is approaching three main amphiboles that are seldom faceted, the actinolite, the pargasite and the edenite. Pargasite is showing a slightly lower DR than the two others as well than the samples since it is usually around 0.020. Actinolite from the solid solution tremolite-ferro-actinolite serie is rather close to the sample except for the optical sign which is negative for actinolite. Edenite is also rather close to the sample since RI, DR and optical sign are matching but the SG is slightly lower than that of the sample.
From the classical gemmology information, it is impossible to conclude on the identity of that amphibole, actinolite, edenite, anything in between ?
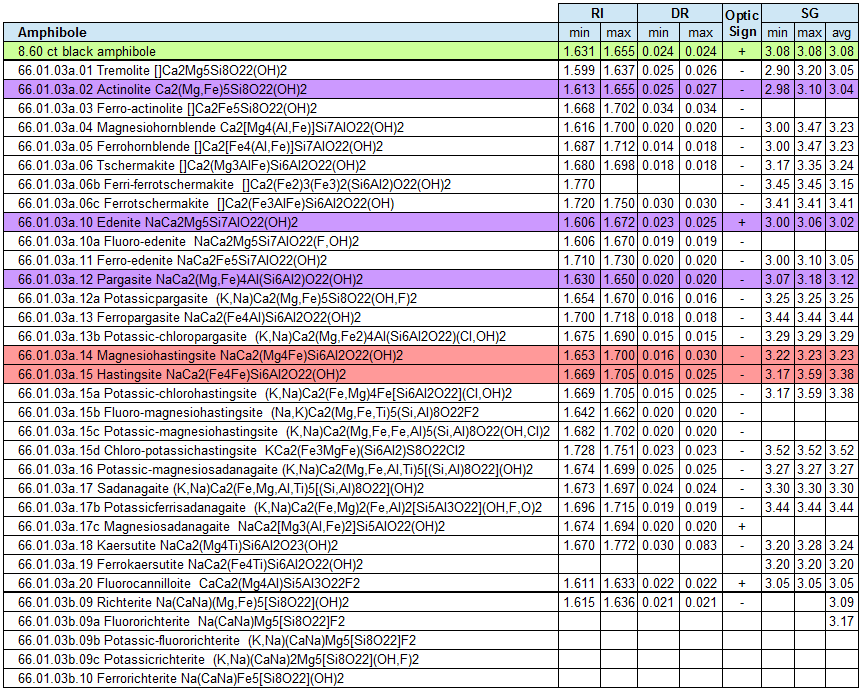
Table 2: Calcic and sodo-calcic amphiboles physical properties (RI, DR, optical sign and SG). The green line highlights the sample, the purple lines highlight the matching amphiboles and the red lines highlight the hastingsite which is excluded since its properties do not match at all.
Available data are somewhat outdated but most of them seems to be still accurate and up to date for some species. Many studies were conducted by A. N. Winchell, early in 1931 with 'Further studies in the amphibole group' [1] and then in 1944 with 'Variations in composition and properties of the calciferous amphiboles' [2]. The tremolite—ferro-actinolite series was well studied and the correlation between optical / physical properties and the Fe contents was refined in the latter study.
Some data about hastingsite, pargasite and edenite series can be found in 'Rock-forming Minerals: Double-Chain Silicates, Volume 2B p 412' [3]. The data presented in the diagram reproduced in figure 2, are consistent with the data listed in the table 2 except for edenite. The double refraction varies from about 0.017 for edenite to about 0.022 for ferro-edenite while recent data give a minimal RI as low as 1.606 and a double refraction around 0.023/0.025. A measured RI and DR of an edenite gem quality from Myanmar are 1.617 - 1.640 and 0.023 with a positive optical sign and a SG around 3.08. Assuming this edenite sample is really an edenite (the sample identity has not been confirmed yet by chemical analysis), again the measured properties do not match those of the figure 2.
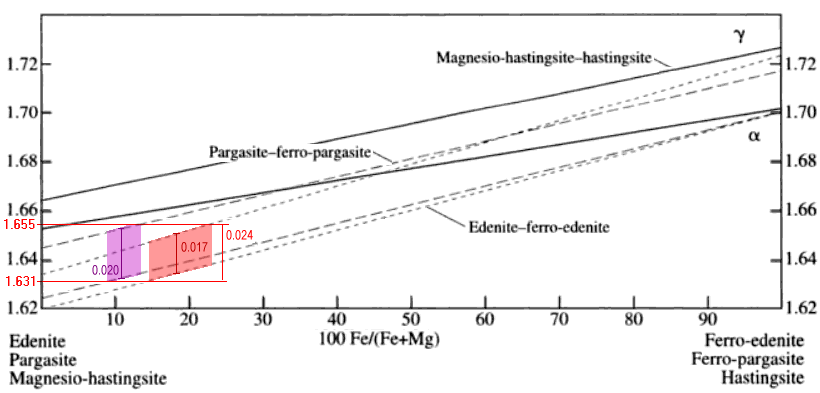
Figure 2: The relationship between the refractive indices and chemical composition of the edenite—ferro-edenite, pargasite—ferro-pargasite and magnesio-hastingsite—hastingsite amphiboles, after Fig. 260 of Rock-forming Minerals: Double-Chain Silicates, Volume 2B p 412 [3].
The black amphibole sample's RI properties are drawn in figure 2, and clearly there is no consistent way to get a possible match. Anyhow, as it was mentioned above, it is safe to assume that this diagram is not reliable as far edenite is concerned.
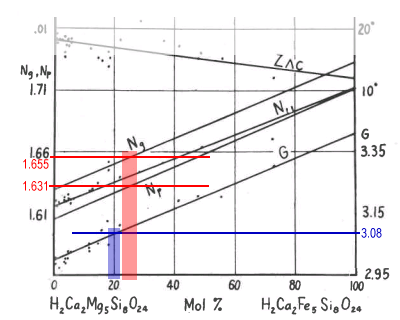 Figure 3: relationship between RI and chemical composition of the tremolite-ferro-actinolite extracted from Winchell [2].
On a similar basis, the diagram showing the relationship between RI and chemical composition of the tremolite-ferro-actinolite extracted from Winchell [2] is reproduced in figure 3. The black amphibole sample's RI (red) and SG (blue) properties are drawn in the diagram. The result is much more coherent than for edenite diagram, RI and DR match the experimental data of Winchell and his extrapolations. An interesting feature is that both RI and SG give nearly the same 'chemical composition' with about 20 to 26% of Fe content (actinolite).
At this stage, it is still impossible to conclude on the identity of this black amphibole. However, even if it was not possible to confirm the sample could be edenite as foreseen with the table 2 data, the studies lead by Winchell [2] reinforce the possibility of a material which is close to actinolite with an approximate chemistry Ca2Mg4FeSi8O22(OH)2.
Infrared reflectance spectroscopy:
The gemstone is faceted and therefore it offers many reflective surfaces that can be used for acquiring spectra. The main face which is the table offers a very good surface and is the first choice candidate for the spectroscopy. Two spectra are collected from it, to get the spectrum of two different area of the table, namely T and T'. The amphiboles being anisotropic, the spectra are expected to be variable depending on the orientation of the face they are acquired. The bands positions should remain the same whereas their intensities vary. As the appearance of a band is depending on its surrounding bands, it can be difficult to locate it, but the strongest one are always distinct and with some experience they can be easily pointed out. The pavilion of the stone can be simplified to four major facets, providing four new directions in the gemstone to acquire a spectrum from, namely P0, P1, P2, P3.
Collected spectra are reproduced in figure 4, the raw spectra being a bit noisy, they were applied some minor correction to slightly smooth them with a 7 points Savitzky-Golay algorithm. This process does not alter significantly the band position, at least for the need we have here and considering also the spectrometer's precision.
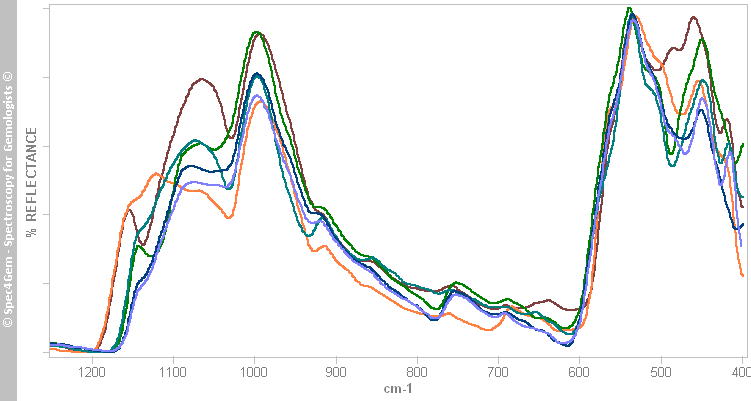
Figure 4: The infrared reflectance spectra of the 8.60 ct black amphibole collected from the different facets of the gemstone, T and T', P0, P1, P2 and P3.
The spectra's shape indicates we have a silicate with its large reflexion bands located in the 800 cm-1 - 1200 cm-1. A first automatic search in my spectra library gives the best matching with amphiboles such tremolite, actinolite, edenite, pargasite but not with hastingsite and thus with a confidence higher than 90%. The result is as expected with respect to the classical gemological analysis.
Four invariable or slighly variable bands can be easily identified in the obtained spectra:
- 678 - 686 cm-1
- 753 - 760 cm-1
- 914 - 920 cm-1
- 992 - 997 cm-1
Some more bands are available but with a higher degree of variability, thus they are not of interest for the comparison with other spectra and they cannot be used as characteristic features.
Figure 5 put together the infrared reflectance spectrum of the 8.60 ct amphibole with the spectra of the most common calcic amphiboles such as tremolite, richeterite, edenite, pargasite, hastingsite and antophyllite for comparison. The four identified bands listed above are depicted with black lines. The best approaching spectrum is the one of the tremolite from the tremolite—ferro-actinolite serie. The richterite is also rather close and the ednite quite different.
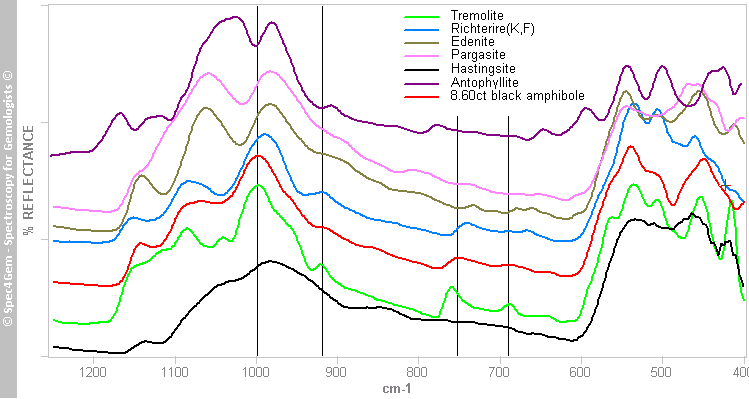
Figure 5: Infrared reflectance spectrum of the 8.60 ct black amphibole compared to the spectra of the most common calcic amphiboles, tremolite, richeterite, edenite, pargasite, hastingsite and antophyllite.
After the following study An attempt to identify amphiboles with infrared reflectance spectroscopy, some characteristic bands have been identified for some calcic amphiboles that can be used to identify the amphiboles. Those bands are listed in table 3.
| black amphibole | tremolite | richterite | edenite | pargasite | |
| band 1 | 992 - 997 | 996 - 999 | 983 - 999 | 978 -985 | 979 - 982 |
| band 2 | 914 - 920 | 915 - 923 | 911 - 925 | (888 &) 914 | (892 &) 909 |
| band 3 | 753 - 760 | 754 - 764 | 733 - 749 | 731 - 734 | 730 - 736 |
| band 4 | 678 - 686 | 676 - 690 | 654 - 668 | 660 - 664 | 662 - 676 |
From the spectroscopic point of view, the 8.60 ct black amphibole is very similar to the tremolite/actinolite and it differs significantly from the richterite, edenite and pargasite.
Crystallography:
Addendum April 2015, data courtesy of the Laboratory of Mineralogy B18, University of Liège, Liège, Belgium.
Crystallographic data are determined using a four circles diffractometer with the following results:
Cell Parameters: a = 9.79Å, b = 17.78Å, c = 5.229Å, β = 104.7°
These results are compared with data collected from different sources on internet and they are listed in table 4 for information. The comparison is achieved by calculating the Euclidean distance between the sample's parameters and the compared amphibole's parameters. The Euclidean distances are scored from the smallest (1) to the highest (13), the score indicating then which amphibole is the closest (1) and which is the farthest (13). The cell parameters data may vary on internet depending on the sources, so the results must be handled with care and a variation of 10-2 in the distance is not really significant. The best scoring amphibole is taramite, folowed by tremolite, magnesiohornblende, actinolite and hastingsite. The worst scoring amphiboles are ferrorichterite, pargasite, sadanagaite and richterite.
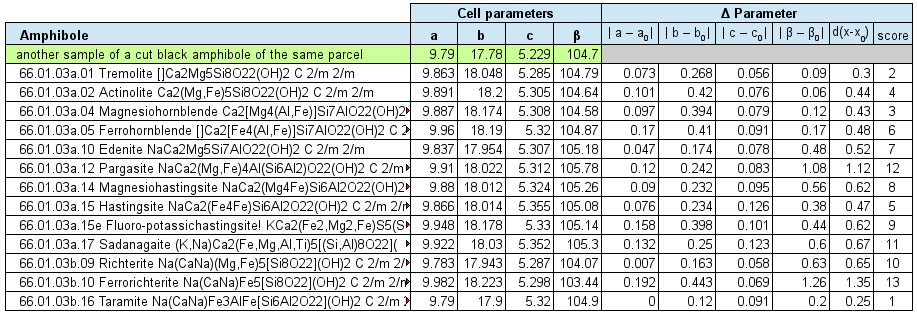
Table 4: Cell parameters of common amphiboles compared to those mesured from another sample of such black amphibole coming from the same parcel. a0, b0, c0 and b0 are the mesured parameters of the sample. d(x-x0) is the Euclidean distance between the sample's parameters and the compared amphibole's parameters. The score column indicates which amphibole is the closest (1) and which one is the farthest (13).
A search into the American Mineralogist Crystal Structure Database[6] gives similar results depending on the tolerance of each parameter. A first search with the following parameters 'a=9.79(20) and b=17.78(20) and c=5.23(20) and beta=104.7(2) gives the seven first entries of the table 5. As for the previous search, here again taramite amphiboles are very close to the sample's cell parameters as well as the katophorite but the closest one by far is the mangani-dellaventuraite. The search is extended by increasing the a, b and c cell parameters tolerance from +/-0.20 to +/-0.25, the result is a new set of 32 amphiboles inclusing ones of the first search, the extra set corresponding to the 0.25 tolerance extend is given in the second part of the table 5. After the first set with mangani-dellaventuraite (1), katophorite (2), and magnesiotaramite (3), the next best scoring amphiboles are fluoro-edenite (5), richterite (6), winchite (7), tremolite (8) and pargasite (8/9).
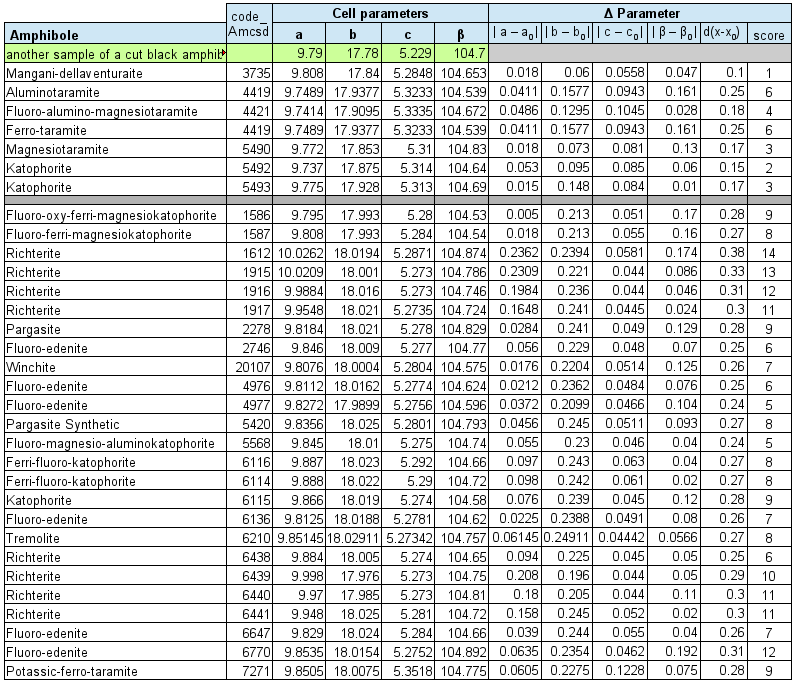
Table 5: Cell parameters of amphiboles matching the following request into the American Mineralogist Crystal Structure Database[6]: a=9.79(25) and b=17.78(25) and c=5.23(25) and beta=104.7(2). The subset of the first seven rows is matching the more constrainfull request with an a, b and c tolerance of +/-20. The code_Amcsd column is the _database_code_amcsd identifier of the amphibole sample in the database. a0, b0, c0 and b0 are the mesured parameters of the sample. d(x-x0) is the Euclidean distance between the sample's parameters and the compared amphibole's parameters. The score column indicates which amphibole is the closest (1) and which one is the farthest (14).
The search against mean values of cell parameters (table 4) gives the taramite, tremolite, magnesiohornblende, actinolite and hastingsite as the best matching amphibole candidates. The search against identified specimen of the American Mineralogist Crystal Structure Database[6] (table 5) gives the mangani-dellaventuraite, katophorite, magnesiotaramite, fluoro-edenite, richterite, winchite, tremolite and pargasite. Katophorite and magnesiotaramite belong to the same taramite group redefined in 2012 amphibole nomenclature.
The optical properties (RI, DR) and physical property (SG) of the best scoring amphiboles listed above are given in the table 6 for comparison to those of the 8.60 ct sample. The sample's RI overlap only with katophorite, all other amphiboles of the list have distinct higher RI. Regarding DR, the closest amphibole is the Katophorite with a DR of 0.020 (0.024 for the sample). The sample's SG is lower than for all other amphiboles of the list for which the SG is known.
| IR | DR | SG | |
| 8.60 ct black amphibole | 1.631-1.655 | 0.024 | 3.08 |
| mangani-dellaventuraite (mindat) | 1.685-1.724 | 0.033 | 3.18 |
| katophorite (mindat + webmineral) | 1.640-1.692 | 0.020 | ? |
| magnesiotaramite | ? | ? | ? |
| taramite (mindat) | 1.654-1.671 | 0.017 | (3.21) |
| taramite (webmineral) | 1.705-1.715 | 0.010 | 3.5 |
amphiboles returned by the search into the American Mineralogist Crystal Structure
Database[6] are listed in this table for comparison to those of the 8.60 ct sample.
Chemistry analysis and Raman spectoscopy were performed and results are still to be published here.
[1] Further studies in the amphibole group - A.N. Winchell - American Mineralogist, Vol. 16, p. 257
[2] Variations in composition and properties of the calciferous amphiboles - A.N. Winchell - American Mineralogist, Vol. 30, p. 27
[3] Amphibole group - Rock-forming Minerals: Double-Chain Silicates, Vol. 2B p. 412 - William Alexander Deer,Robert Andrew Howie,J. Zussman
[4] Nomenclature of Amphiboles: Report of the Subcommittee on Amphiboles of IMA - B.E. Leake & Al, Mineralogical Magazine, Vol. 61, p. 295, April 1997
[5] Nomenclature of amphiboles: Additions and revisions - B.E. Leake & Al, American Mineralogist, Vol. 89, p. 883, 2004