
1.03 ct blue-green emerald from Kafubu, Zambia
- Details
- Created: Monday, 28 August 2017 19:58
For most of people, fine emeralds are sourced in Colombia. Brazil appears to be another important source for emeralds, mainly for mid-grade product. Since 1976, large scale emerald mining began in Zambia. Zambian stones' color tends to be a more saturated green than the Colombian ones. The most notable about Zambian material is its transparency and clarity with fewer fractures and fissures than Colombian one.
To date, Zambian emeralds represent about 20% of the world's production. Two distinct area in the northern Zambia produces emeralds, Kafubu and Musakashi. The stones from these two localities differ by their chemical composition, the first ones are Fe-rich emeralds and the last ones are Cr-rich emeralds. This difference is easily observed using UV-Vis-NIR spectroscopy.
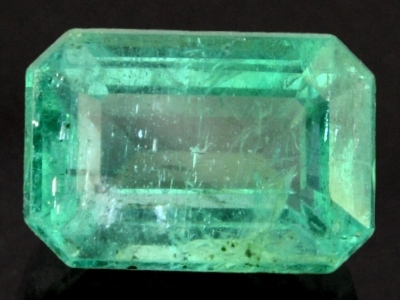 Figure 1. The 1.03 ct blue-green emerald from Kafubu, Zambia.
| Shape | rectangular, emerald cut |
| Size | 7.1 x 4.9 x 3.7 mm |
| Color | blue-green |
| Lustre | vitreous |
| Weight | 1.03 ct |
| SG | 2.78 [Kafubu: 2.69 - 2.78 [1]] |
| RI | 1.586-1.593 [Kafubu: 1.578-1.599 [1], 1.582-1.593 [2]] |
| DR | 0.007 Uniaxial negative |
| Pleochroism | moderate: greenish-blue / yellow-green |
| Polariscope / Conoscope | uniaxial figure |
| SWUV | inert |
| LWUV | inert |
| Magnetic susceptibility N52 | very weak (Fe ?) |
| Chelsea filter | green |
Table 1. Observational and measured properties
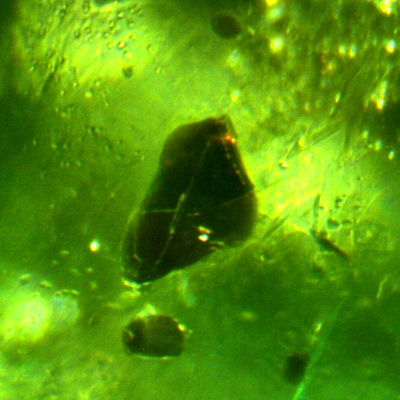 Figure 2. Platy brown mica-biotite cristals inclusions (top, bottom).
Center: brown crystal of unknown nature.
Transmitted light, immersed in alcohol.
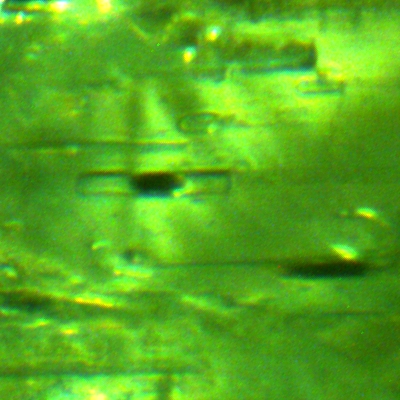 Figure 3. A long rectangular two phase inclusion.
Transmitted light, immersed in alcohol.
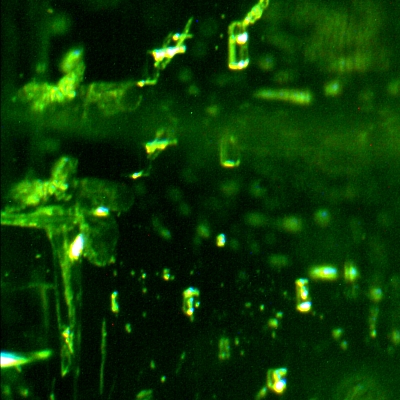 Figure 4a. Left: Unknown inclusion, transparent, looks like a spicule,
already seen but cannot remember what it is! Right: rectangular
multiphase inclusions. Top: duplicated view of the inclusions.
Darkfield.
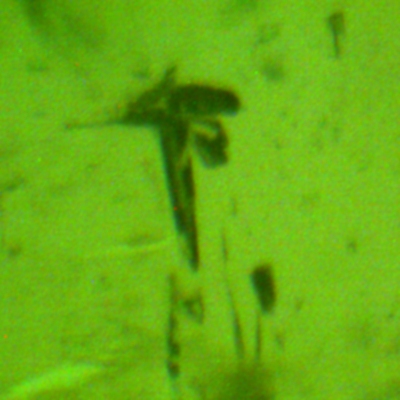 Figure 4b. Same inclusions as in figure 4a, but in transmitted light.
Transmitted light, immersed in alcohol..
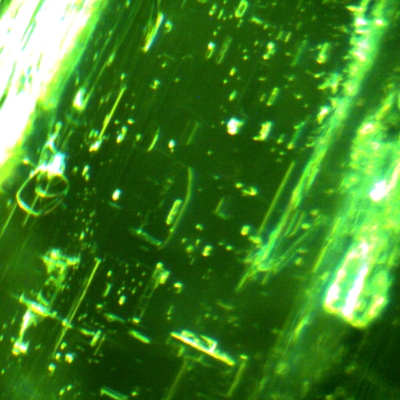 Figure 5. Aligned rectangular multiphase inclusions oriented in two
perpendicular directions.
Darkfield.
This emerald has several solid brown inclusions, some transparent, other opaque (figure 1, figure 2), the platy transparent one are mica-biotite. Long rectangular two phases inclusions are present (figure 3). A quite large and transparent spicule lookalike can be observed (figure 4a, 4b), it does seem to be a classical spicule as observed in some synthetic emeralds. It is accompanied by rectangular multiphase inclusions. A scene with numerous rectangular multiphase inclusions all aligned together, in two perpendicular directions (figure 5).
Infrared reflectance spectroscopy:
The IR reflectance spectrum (figure 6) was acquired from the stone's table and shows the table plane is almost parallel to the C-axis since the spectrum is characteristic of the beryl emerald variety while acquired from a hexagonal prism face (1010). The bands positions may vary from one emerald to another, here the bands are in the low end of the varying range. For example, the last main band towards high energies is as low as 1263 cm-1.
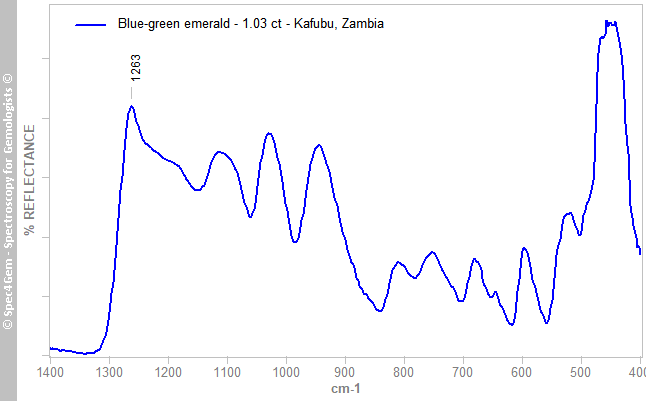 Figure 6. The IR reflectance spectrum of this 1.03 ct emerald acquired from the table (approximately a (1010) crystal face)) shows a characteristic beryl reflectance spectrum. The bands positions may vary from one emerald to another, here the bands are in the low end of the varying range. For example, the last main bands towards high energies is as height as 1263 cm-1.
UV-VIS-NIR spectroscopy:
The UV-Vis spectra (figure 7, E_|_C in dark-green and E||C in light-green) of this 1.03 ct emerald show four main bands at 428 (Cr3+, Fe3+), 454 (Fe), ~614-620 (Cr3+) and 833-880 (Fe2+) nm. Additionally to these strong features, in the E_|_C spectrum, there is a large band between 600 and 750 nm assigned to Fe2+/Fe3+ CT (charge transfer). Some secondary features are present at 640, 655, 667, 684-687 nm all related to Cr3+ and then at 960 nm related to H2O. The strong edge below 400 nm is related to Fe and likely hides the Fe3+ 370 nm bands which are not definite in these spectra.
This emerald is a rich-Fe emerald, iron strongly modifies the stone's green color.
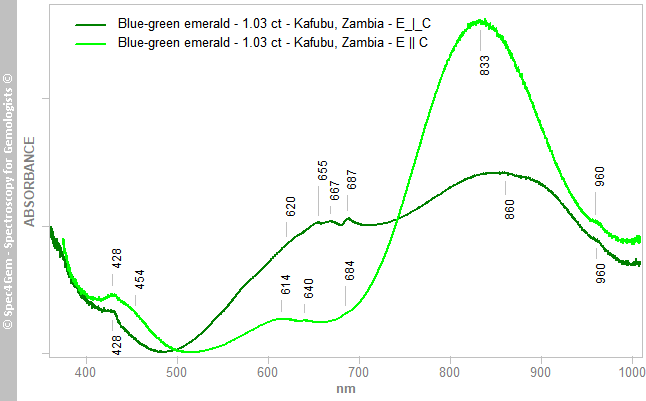 Figure 7. The UV-Vis spectra (E_|_C in dark-green and E||C in light-green) of this 1.03 ct emerald show three main bands at 428 (Cr3+, Fe3+), 454 (Fe), ~614-620 (Cr3+) and 833-880 (Fe2+) nm. In the E_|_C spectrum, the large band between 600 and 750 nm is assigned to Fe2+/Fe3+ CT. Secondary features are present at 640, 655, 667, 684-687 nm all related to Cr3+ and then at 960 nm related to H2O. The strong edge below 400 nm is related to Fe and likely hides the Fe3+ 370 nm bands.
Photoluminescence spectroscopy:
Although this emerald being inert to SWUV and LWUV using UV cabinet, it shows a very faint red luminescence with a 405 nm laser. The photoluminescence spectrum (figure 8) shows a single emission peak at 722 nm with a weak shoulder around 689 nm. The emission at 722 nm can be attributed to Cr3+ and possibly to Fe3+. The shoulder at 689 nm is related to the Cr3+ R-lines. They are not well defined here but this is the result of the unoriented spectrum, these R-lines features are dependant of light polarization.
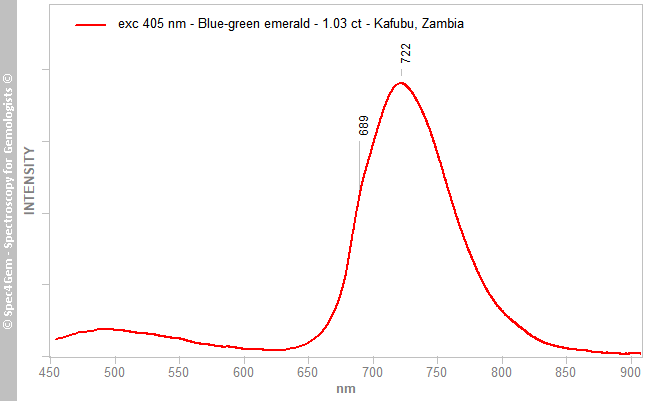 Figure 8. The unoriented photoluminescence spectrum obtained with a 405 nm laser shows a single emission peak at 722 nm with a weak shoulder around 689 nm. The emission at 722 nm can be attributed to Cr3+ and possibly to Fe3+. The shoulder at 689 nm is related to the Cr3+ R-lines which are not well defined (unoriented spectrum).
Conclusion:
Classical gemology and spectroscopic data are undoubtedly consistent with that of emerald (beryl). The refractive indexes are in the high end range for emerald, indicating a high iron content, that is confirmed by UV-Vis spectroscopy since the spectrum is mainly related to Fe and in a less extend to Cr3+.
All properties are consistent with that of Kafubu Zambian emeralds.
Clarity enhancements (oil/resin filling) has not been found out.